Data Pane: Data sheet, tables, properties view, and atom list
The data pane
in the right half of the document window offers several auxiliary views to work with structure pictures:
- Data sheet or tables of atoms, bonds or other objects or atom list in the upper part and properties view in the lower part.
- Data sheet: overview of contents, different configurations.
- Table of atomic or connection parameters or table of created atoms, bonds, or other objects.
- Properties view: showing infos about the selected atom, bond etc. (in picture or in table).
- Atom list: a hierarchical list of atom groups, atom sites, and created atoms of a structure picture - or a list of molecules and their constituent atoms.
Previous article: Color coding of structural parameter sets
Next article: Recent pictures
Overview
The data pane has an upper part showing either a formatted summary of the structure parameters as well as some derived geometric informations,
which we call the data sheet, or tables showing different kinds of objects in the present state of the structure picture.
The lower part contains the so-called properties view showing information dependent on the context.
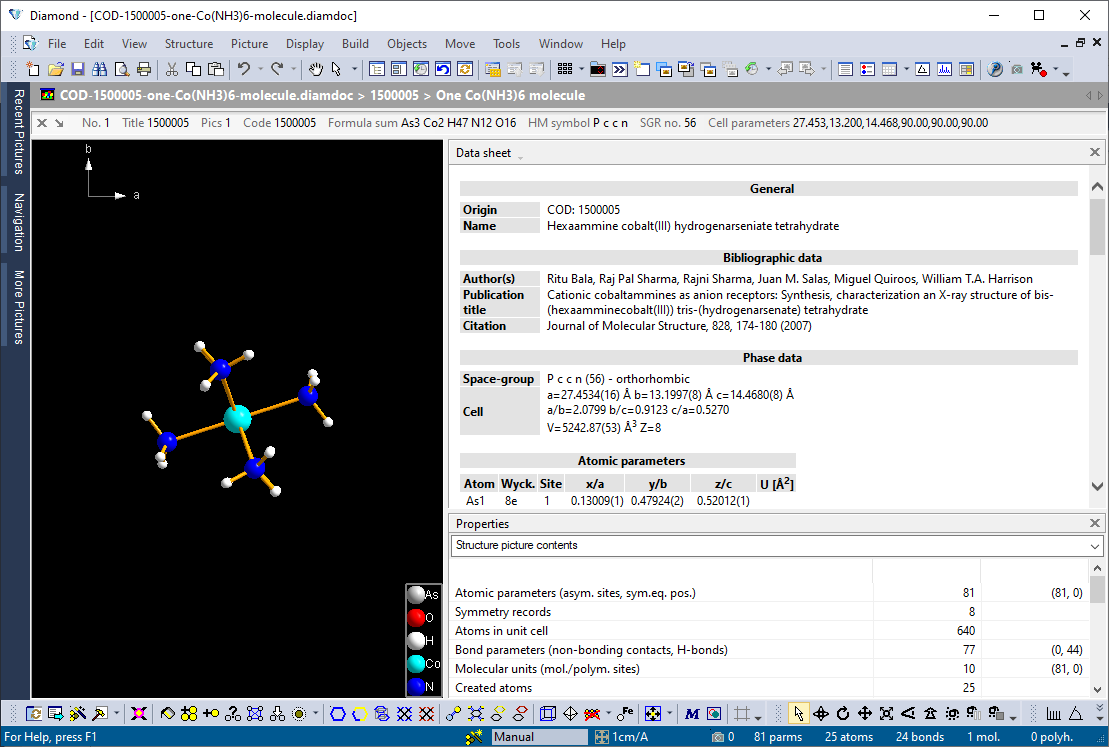
The following screenshot shows the default arrangement of panes for a structure picture being edited:
The structure picture pane in the left part and the data pane (on the right side) containing the data sheet in the upper and the properties view in the lower half.
The data sheet gives you a summary of the bibilographic and structural data.
The properties view shows the structure picture contents, which means the number of atoms in the parameter list, bond and contact parameters, if given,
as well as the counts of atoms, bonds, and other objects in the structure picture.
Please note that some short information about the structure is also available from the structure info bar (the row above structure picture and data sheet),
and the counts of atoms, etc. are also available from the status bar.
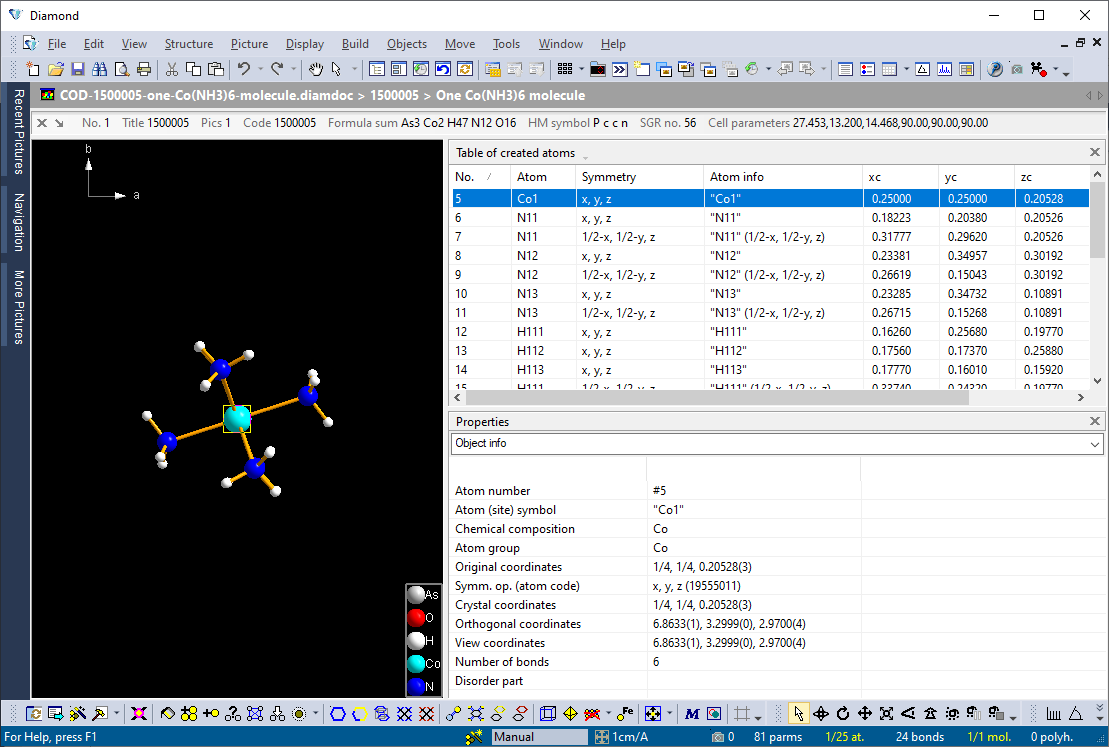
The next screenshot shows the table of created atoms instead of the data sheet with a single atom selected in both table and picture,
while the Properties view shows an info about the (selected) object, here: the properties of the selected atom:
Data sheet
The Data sheet is a tabular representation of the complete structure parameter set and associated information, e.g. bibliographic data.
The contents of the data sheet can be "brief", "comprehensive", or "customized".
While "comprehensive" displays all information that is present in the current Diamond document,
"brief" displays only a summary of the most important structural data.
Please find more information about the data sheet contents in the article "Data sheet contents".
Besides the options "brief" and "comprehensive", the data sheet can be customized by the user, i.e. the selection and order of the items as well as a few more options can be changed.
This is described in the article "Customizing a data sheet".
Tables
The commands to show a data table, e.g. the "Table of atomic parameters" are listed in the Tables sub-menu of the View main menu.]
Instead of using a command from the View/Tables sub-menu of the main menu, you can also select the command, e.g. Table of atomic parameters from the top of the Tables pane,
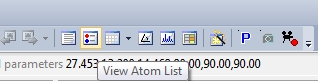
or from the main toolbar: There is a toolbar button to access the latest used table (default is the table of atomic parameters),
or use the dropdown arrow right beneath the button to open a dropdown menu, as shown in the screenshot:
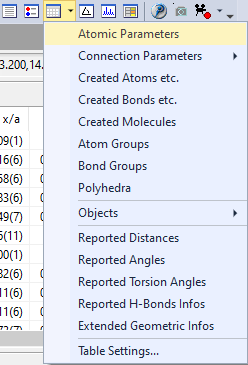
Screenshot of a part of the main toolbar. The icon to access the latest used table is highlighted in yellow. Left beneath are icons for data sheet and atom list. Right beneath are icons for distances and angles view and powder pattern view. The third icon is to show or activate the Properties view.
The following tables are available:
- Table of atomic parameters:
This table contains a list of all atoms in the parameter list of the crystal structure description, along with their elements, symbols, oxidation states, Wyckoff letters and coordinates.
- Table of bond parameters:
This table contains a list of all bonds in the parameter list of the crystal structure description,
along with the labels and symmetry operations of the two constituent atoms each as well as bond type and interatomic distance in Angstroem.
The coordinates of the two atoms can be displayed optionally, cf. the command "Table Settings..." from the context menu of the table.
- Table of contact parameters:
This table contains a list of all contacts in the parameter list of the crystal structure description,
along with the labels and symmetry operations of the two constituent atoms each as well as the interatomic distance in Angstroem
as well as relative to the sum of the van der Waals radii of the two atoms each. The coordinates of the two atoms can be displayed optionally.
- Table of H-bond parameters:
This table contains a list of all H-bonds in the parameter list of the crystal structure description,
along with the labels and symmetry operations of donor, acceptor and H/D atoms each as well as the interatomic distances in Angstroem
between donor and H-atom ("Dist. D-H), H-atom and acceptor ("Dist. H..A"),
as well as donor and acceptor (as absolute value "Dist. D..A" as well as relative to the van der Waals radii sum "d(D..A) - vdW"),
followed by the angle between donor, H/D and acceptor ("D-H..A") in degrees.
The symmetry operations of the three atoms as well as more distance values relative to the van der Waals radii sum can be displayed optionally.
- Table of created atoms:
This table contains a list of all atoms that are currently present in the structure picture, along with their "source atom" in the atomic parameter list,
the symmetry operation applied, and the coordinates. Besides this, also pseudo-atom objects (e.g. cell corners) are listed in the table.
- Table of created bonds:
This table contains a list of all bonds that are currently present in the structure picture, along with their connected
"source atoms" in the atomic parameter list, the corresponding atom codes, and the bond length.
Besides this, also pseudo-bond objects like cell edges are listed in the table.
- Table of created molecules:
This table contains a list of all molecules in the current structure picture, regardless, if complete or as fragment. Polymers and vagabonding atoms are not listed.
- Table of atom groups:
This table contains a list of all atom groups that are currently defined.
Atom groups can be defined or modified using the corresponding command from the Build menu.
Atom groups (and bond groups) are described in the article "About atoms, atom groups, bonds, and bond groups".
- Table of bond groups:
This table contains a list of all bond groups that are currently present,
along with their current Connectivity settings (Dmin, Dmax) and other information.
Bond groups are automatically created from all possible pairs of atom groups.
- Table of polyhedra: This table contains a list of all polyhedra that have been created up to now e.g. using the Add Polyhedra
or Construct polyhedron command from the Build/Polyhedra menu.
For every polyhedron, additional information like the symbol of the central atom, the number of ligands, the number of faces etc. are displayed.
See more informations in the article "Polyhedron selection and properties".
- Table of plane objects:
This table contains a list of all hkl- or least-squares planes that have been created by the user using the Create Lattice Plane... or Create Plane through Atoms... command
in the Objects/Planes menu. For every plane, the hkl-values or plane parameters as well as the contributing atoms are displayed.
Read more about planes (and lines) in the article "Plane and line objects".
- Table of line objects:
This table contains a list of all least-squares lines that have been created by the user using the Create Line through Atoms... command in the Objects/Lines menu.
For every line, the line parameters as well as the contributing atoms are displayed.
- Table of reported distances/angles/torsion angles
These tables contain lists of all distances, angles, or torsion angles, rsp., that have been measured up to now using the commands Measure Distances etc. from the Tools menu.
- Table of reported H-bond infos
Every line of this table corresponds to an H-bond pre-defined in an imported CIF-file (CIF data name _geom_hbond),
along with their connected "source atoms" in the atomic parameter list, the corresponding symmetry operations, and the bond lengths or interatomic distances.
- Table of extended geometric infos
This table contains a list of all geometric data that have been measured up to now using the geometric analysis "Measure Planes etc." command from the Tools menu.
Find more details in the article
"Extended geometric infos: Angles between planes etc.".
The Settings command from the Table sub-menu of the View main menu opens the Settings dialog for the active table.
Here, you can select which columns shall be displayed, the sort criterion and some additional options (full row selection and display of a grid or not).
For more details about the different tables, the columns that are used and how to use them to select objects in the structure picture,
read the article "Tables of objects like atoms, bonds, molecules etc.".
Properties view
The Properties view shows informations in context with the current
situation, e.g. the contents of the structure picture you are working with, properties of the selected atom, distances around the selected
atom, centroid or best plane or line through selected atoms, and many more.
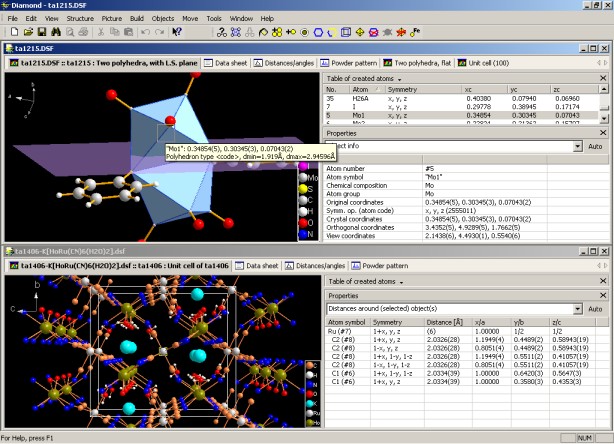
The screen shot below (from an older version of Diamond) shows an info about the currently selected object
(here: "Mo 1", which is also center of a polyhedron) in the upper window. In
the lower window you have a list of atoms in the environment of the selected
atom (here: "Ru 7" at 1+x,y,z).
The (optional) Info Tip in the structure picture shows short
information about the object (atom, bond, etc.) under the mouse cursor.
To show (if it is not yet visible) and to set the input focus to the Properties view, use the Properties View command from the View main menu.
As mentioned above, It displays various kinds of information, which can be selected from the dropdown box between the properties pane title
bar and the actual properties pane contents. These are:
- Structure picture contents: A summary of the atom counts in the atomic parameter
list, in the unit cell, in the structure picture (created atoms) as well as counts
for bonds and other objects, like cell edges, labels, polyhedra, geometric informations,
etc.
- Created atoms in structure picture: A summary of the created atoms' counts
associated to the atom groups each.
- Object info: Informations about the object currently selected in the structure
picture, depending on the kind of object (atom, bond, etc.). The information is
only available if exactly one object is selected.
- Selected objects: A summary of the objects currently selected in the structure
picture, grouped by object types, if different kinds of objects are selected at
a time, e.g. atoms and bonds.
- Distances around selected objects: Table of central atoms associated with
the atom(s) selected in the structure picture or in the table of created atoms or
of the atom sites or groups selected in the tables of atomic parameters or table
of atom groups, rsp., followed by neighbouring atoms and distance values each. The
distance range can be changed in the Properties Settings dialog,
available through the Properties Settings command from the properties pane context menu.
- Distances between selected objects: A matrix of distance values between the
atoms currently selected in the structure picture.
- Histogram of distances: A histogram of distances, depending on the current
context. If the structure picture or the table of created atoms has the input focus,
the histogram contains distances around all selected atoms. If an atom of the table
of atomic parameters or table of atom groups is selected, the histogram considers all selected (central) atom sites. If
one or more bonds are selected, their bond lengths are shown in the histogram. If
a bond group is selected, all distances between atoms of the two atom groups are
considered in the histogram. The maximum distance value of the histogram can be
changed in the Properties Settings dialog.
Note: The distances histogram is also used when you show the table of (calculated) distances and/or angles.
This is done through the Distances and Angles command in the View menu and described in more details
in the articles "Table of distances and angles" and
"Distances around a selected atom".
- Linearity of selected atoms: A table of the selected atoms and their distances
and standard uncertainties from a least-squares line through these atoms.
- Planarity of selected atoms: A table of the selected atoms and their distances
and standard uncertainites from a least-squares plane through these atoms.
- Center (coordinates) of selected atoms: A table of the selected atoms' coordinates
as well as the coordinates of the center of these atoms (the mean values of the
atoms' coordinates).
- List of assigned atoms: List of created atoms (symmetry-equivalent positions)
in the structure picture that are associated with the selected atom in the table
of atomic parameters or the selected atom group in the table of atom groups.
- Faces of selected polyhedron: A list of the selected polyhedron's faces with the
atoms on the corners each and their symmetry operations and crystal coordinates.
Note: The properties of polyhedra and their ligand atoms, faces, and edges are described in more details
in the article "Polyhedron selection and properties".
- Edges of selected polyhedron: A list of the selected polyhedron's edges with
the constituent atoms each and their labels, distance to center, symmetry operation
and crystal coordinates.
- Ligand atoms of selected polyhedron: A table of the selected polyhedron's
ligand atoms with label, distance to center, symmetry operation and crystal coordinates
each. For a selected Voronoi polyhedron, the neighbouring atoms and vertices are listed.
- Dirichlet domain (Voronoi polyhedron): An info about the Dirichlet domain
of the atom selected in the structure picture or table of created atoms or table
of atomic parameters.
Note: The properties of Dirichlet domains and Voronoi polyhedra are described in more details in the articles
"Determination of atom site environments basing upon Dirichlet domains (Voronoi polyhedra)"
and "Creating Voronoi polyhedra".
- Diffraction diagram: A diffraction diagram of the current structure data set.
The settings can be changed with the Diagram Settings command from the diagram's context menu.
Note: Usually the diffraction diagram is shown in the Properties view when you run the Powder Pattern command from the View menu,
which also shows or switches to the table of reflection parameters in the pane above the properties pane.
Find more details in the article "Powder pattern simulation".
Automatic mode
By default,
the properties pane is set to "Automatic" mode, meaning that Diamond decides which information to show dependent on the current context.
You can choose a different setting from the above mentioned dropdown list to force a special property to be shown.
To go back to the "automatic" mode selectthe corresponding
first line in the dropdown box at its top, so that it always displays context-sensitive information depending on the currently selected objects.
Hiding the Properties pane
You can close the Properties pane by clicking on the "x" at its top.
To re-display it again, use the Properties View command from the View main menu.
Atom list
The "Atom list" is a special, hierarchical list showing different aspects of atoms in the structure picture - either as a list of atom groups, atom sites, and created atoms
or as a list of molecules and their constituent atoms.
It contains informations from both table of atomic parameters,
created atoms, and atom groups as well as table of created molecules in one table. Unlike the above mentioned tables of atomic
parameters, created atoms, etc., the atom list uses several options to group or
indent items.
To show the atom list in the data pane right beneath the structure picture pane,
use the command Atom List from the View menu.
Or simply click the corresponding button in the main toolbar.
The two screenshots below show the two variants of the atom list for the sample file "COD-1500005-one-Co(NH3)6-molecule.diamdoc",
the left one with atom groups, atom sites, and "created atoms", the right one with molecules and their constituing atoms:
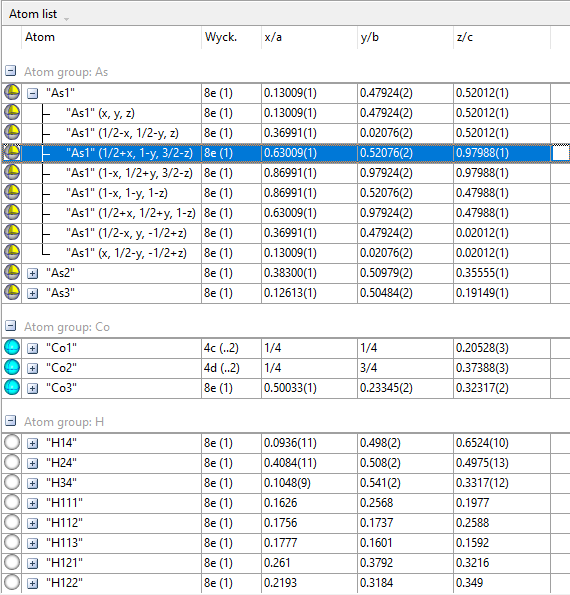
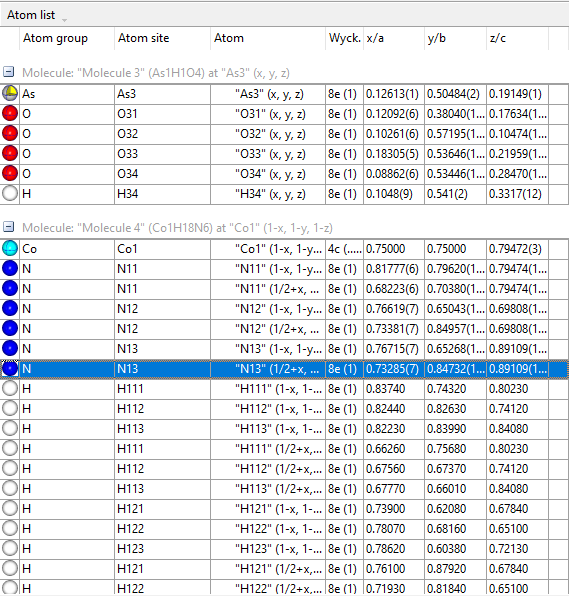
Please find a detailed description how to work with the "Atom list" here: "Atom list": Hierarchical list of atom groups, atom sites, and created atoms
of a structure picture.
Previous article: Color coding of structural parameter sets
Next article: Recent pictures
Reference:
COD:1500005: Hexaammine cobalt(III) hydrogenarseniate tetrahydrate; Ritu Bala,
Raj Pal Sharma, Rajni Sharma, Juan M. Salas, Miguel Quiroos, William T.A. Harrison;
Journal of Molecular Structure, 828, 174-180 (2007).
|